Friday, August 31, 2012

Graph Views

OBIEE11g – Graph Views

Let us understand a couple of charts Views, now called as Graph in OBIEE11g and properties of these graphs.

Create a simple Graph
1. Bar Graph: Create Bar Graph: Select the required columns from the subject area.

Click on the results, this will bring you the tabular (table) form of report. Select on new View and click on Graph > Bar > Vertical.
In Bar Graph, you can find vertical, horizontal, stacked vertical and stacked horizontal.


The above graph is the default Bar graph. You can find some important icons on the header of the graph, edit graph properties, show graph results, and show/hide graph layout pane.
In the Layout pane, you need to place the columns in graph prompts if you want that column to act as prompt, in section, if you want column to act as section which will display all values in different section, in measures, bars etc to create right bar graph.
There is a slider option in section. This is a new feature in OBIEE11g, if you check mark on the “Display as Slider” and set the section properties to 5 as an example, that column will work like slider in the graph.

I have placed the columns in right places. You can see below graph results.

After creating the Bar graph, click on Done and save the analysis.
You can go to the graph properties; the Bar graph properties are same as it was in 10g version with few new features.

All the options are self-explanatory, you just need to check each of these options and understand its results.
Important Properties: Zoom and Scroll: Use this option to zoom details in the graph.
2. Line Graph
Follow the above process to select the required columns in the reports before you create the Line Graph.
Go to new View and select Line Graph. There are 3 line graph style and you can use graph in 2D or 3D.
Zoom option on the graph properties to zoom the graph in particular area and zoom out as well. This is the new feature in OBIEE11g.

Make use of all graph formats available in OBIEE11g which are better compared to OBIEE10g. After creating the Line graph, click on done and save the analysis. I will not go through all the graph views at this moment and will do based on the request.

Thanks,
Satya Ranki Reddy

Sunday, August 26, 2012

Hierarchies in OBIEE 11g Part 1

Filed under: Hierarchies,OBIEE 11g,Uncategorized

Hierarchies in OBIEE 11g – Part 1
It’s extremely exciting to see the breadth and depth of OBIEE 11g features. There are many things which were constrained till previous release, 11g fixed most of them.
Let us start with Hierarchies and see how to implement different types of hierarchies in BI 11g with step by step example. This article is specific to Value Based Hierarchies.
Hierarchy:
There are different types of hierarchy which exists in an Organization data which gives more insight for our analysis.
1. Level Based Hierarchy:
Basic type of hierarchy which has fixed number of levels. For example Time Dimension hierarchy is a good example for this one.
Year->Quarter -> Month

We have two special cases of level based.
· Ragged Hierarchy
Members of certain levels don’t have child members.

· Skip Level Hierarchy
Level itself will not be present in case of certain hierarchies. In the above diagram if we consider “direct” as a delivery mode under “wholesale” it becomes skip level hierarchy.
1. Value Based Hierarchy
This will be called as parent child hierarchy too. Typical reporting structure in an organization is a good example for this one.

In this article let us see how to create a value based hierarchy step by step.
Believe me creating value based hierarchy in 11g is like walking on ice J
Let us consider employees table which has Manager -> Employee relationship and model the same.
Steps:
1. Importing the source table(Employees)
2. Creating value based hierarchy in BMM layer
a. Define parent(Manager_ID) & child(Employee_ID) columns
b. Generate parent -child hierarchy table DDL statements
c. Generate parent – child hierarchy table DML statements
d. Execute DDL & DML and create hierarchy table and insert data into it
3. Pull the BMM model into presentation layer
4. Run answers and check the output.
Make sure Employees table has below structure.

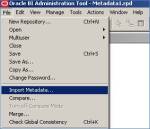
1. Importing Employees table into Physical layer

Finally update the row count and test the database connectivity

2. Create value based hierarchy in BMM layer
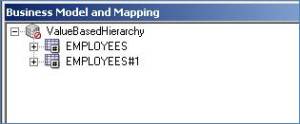
Drag employee table twice to the BMM (OBIEE requires star model) as shown below

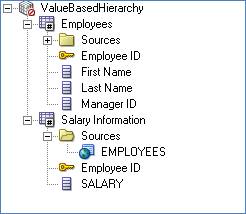
Rename the columns and do the basic cleanup

Right click on the BMM model and join the Employee and Salary Information.

Now right click on Employees logical table and choose for new parent child hierarchy

Choose the member key (by default it will take the primary key) and parent column as shown in the below screenshot.

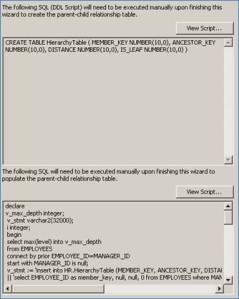
Then click ok parent- child settings. This is the place where we are going to generate the DDL & DML scripts which we can use to create and populate the hierarchy table which will be used by BI server to report parent child hierarchies.

Click on new hierarchy table (middle one – yellow arrow). If you have already generated hierarchy table then click on the select (red arrow) and choose the table.
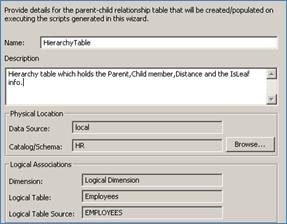
After clicking new give the name for the DDL and DML scripts. This wizard will create the SQL scripts.

Give name for the hierarchy table

Click next and verify the scripts

After finishing you can see the details are mapped now

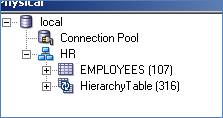
After finishing the wizard you can see the HierarchyTable got imported automatically.

Now go to the scripts location and run the DDL & DML scripts and commit the changes via SQL command prompt
Update the row count and make sure table got created properly

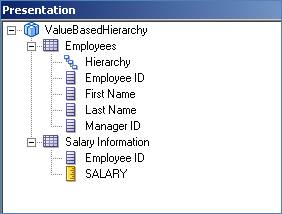
3. Pull the BMM model to presentation layer and create presentation folders.
Make sure that Hierarchy inside the Employees folder is visible.

Now we are done with the metadata definition. Save the RPD and make sure there are no consistency errors.
Start the WLS and BI services and make sure all of them are running fine.
4. Running answers and verifying the hierarchy
Before logging into answers lets enable the logging so that we can check the physical SQL’s that are getting generated while performing drill down’s through hierarchy.
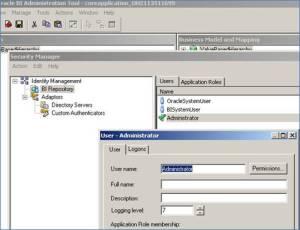
Open the RPD in online mode and navigate to Manage->Identity and set the log level for Administrator.

Check in the changes and close the RPD.
Login to URL http://localhost:9704/analytics using Administrator/Admin123
After logging in since we changed the log level in online mode we have to reload the metadata.
Click on Administration on the top right

Then click on Reload files and Metadata

Then go to our Analysis like below

Click ok ValueBasedHierarchy
Select the Hierarchy column from Employees and the salary measure from the fact.

Then click on results.
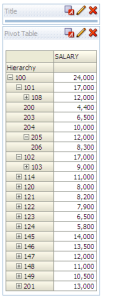
We are done and can see the hierarchy information like below.

This output just shows the salary for each employee and their manager information. This result set is not an aggregated salary for each level. Since salary information pertains to each employee salary is not aggregated.
If you check the Nquery log BI server generates only one query for the any number of operations. It’s fully in memory operation.

Thanks,
Satya Ranki Reddy

Saturday, August 25, 2012

Issues while Exporting OBIEE Answers Report to Excel


You can try adding the below statement in the Custom CSS section of the column properties.


mso-number-format:"\@"

Same above problem other solutions;
'<span style="display:none">&nbsp</span>' ||  CAST("- Vb D Prev Pol Insurer Details"."Prev Pol Num" AS CHAR)
Note : '<span style="display:none">&nbsp</span>' just add it this  fx function like below.


Thanks,
Satya Ranki Reddy


OBIEE - Converting seconds to Minutes/Hours/Days

Days HH:MM:SS
CAST(FLOOR(“TimeInSeconds_Column” / 86400 ) AS VARCHAR(4)) || ‘Days ‘ || CAST(FLOOR(MOD(“TimeInSeconds_Column” , 86400 ) / 3600) AS VARCHAR(4)) ||’:'|| CAST(FLOOR(MOD(“TimeInSeconds_Column” , 3600 ) / 60) AS VARCHAR(4)) ||’:'|| CAST(MOD(“TimeInSeconds_Column” , 60) AS VARCHAR(4))

HH:MM:SS
CAST(FLOOR(MOD(“TimeInSeconds_Column” , 86400 ) / 3600) AS VARCHAR(4)) ||’:'|| CAST(FLOOR(MOD(“TimeInSeconds_Column” , 3600 ) / 60) AS VARCHAR(4)) ||’:'|| CAST(MOD(“TimeInSeconds_Column” , 60) AS VARCHAR(4))

Thanks,
Satya Ranki Reddy


OBIEE GO URL Examples


Integrating Analytics Reports using Go URL syntax
Analytics supports a versatile “Go URL” syntax to incorporate Analytics content into external portals.

Go URL with parameters can be posted as a Form or
Issue it as a URL with parameters.

If you are issuing parameters as part of a URL, they need to be escaped properly.

Calling GO URL

When calling from within Analytics Dashboard or HTML view simply use the URL

saw.dll?GO

When calling from another screen from the same Web server then use the syntax

/analytics/saw.dll?Go

When calling from a different Web server the use full syntax
http://server_name_or_ip_address/Analytics/saw.dll?Go

Authentication with the GO URL

It is assumed that Analytics Web site has Single Sign On (SSO) enabled within corporate web-sites.Single Sign On authentication information is not required as a part of the “Go URL”. If Single Sign On is not enabled then additional authentication parameters must be supplied with the Go URL
http://server_name_or_ip_address/Analytics/saw.dll?Go&NQuser=xxx&NQPassword=xxx

Structure of the Go URL

Basic structure of the Go URL is as follows:

saw.dll?Go&Path=/Shared/Training/ParameterReport

Here, the path is the catalog path for the Analytics report ParameterReport. This basic URL syntax displays the default result view for the report in standard style.

There are number of optional arguments to this URL syntax

Displaying Report Results in different format

Display ‘Modify’, Download’ ‘Print’, ‘Refresh’ options along with the report

saw.dll?Go&Path=/Shared/Training/ParameterReport&Options=mdr

Print report in HTML format
saw.dll?Go&Path=/Shared/Training/ParameterReport&Action=print

Print in xx format, where xx=PDF,Excel, mht or xml
saw.dll?Go&Path=/Shared/Training/ParameterReport&Action=print&format=pdf
saw.dll?Go&Path=/Shared/Training/ParameterReport&Action=print&format=excel
saw.dll?Go&Path=/Shared/Training/ParameterReport&Action=print&format=mht
saw.dll?Go&Path=/Shared/Training/ParameterReport&Action=print&format=xml

Download report directly in the xx Format where xx= Excel, csv or mht
saw.dll?Go&Path=/Shared/Training/ParameterReport&Action=download&format=csv
saw.dll?Go&Path=/Shared/Training/ParameterReport&Action=download&format=excel
saw.dll?Go&Path=/Shared/Training/ParameterReport&Action=download&format=mht

Note that download does not support filters to be passed from the GO URL

Showing specific view of the report
saw.dll?Go& Path=/Shared/Training/ParameterReport &ViewName=pivot

Displaying all the records in a table view
saw.dll?Go&Path=/Shared/Training/ParameterReport &Action=Scroll&P5=-1&ViewID=go~Table

Displaying Dashboard or Dashboard Pages

Syntax for displaying entire Dashboard or specific Dashboard pages URL syntax is
saw.dll?Dashboard&PortalPath=/shared/Training/_Portal/Training

Displaying specific Dashboard page
saw.dll?Dashboard&PortalPath=/shared/Training/_Portal/Training&Page=Sales%20by%20Region

Displaying specific Dashboard page in PDF format
saw.dll?Dashboard&PortalPath=/shared/Training/_Portal/Training&Page=Sales%20by%20Region&Action=print&format=pdf

Passing Parameters to the Report using Go URL optional argument

The Go URL can also be used to pass context such as filters to a destination request. This is done by adding additional parameters to the call. You need to make sure that any columns you are passing are set up in the destination with Is Prompted filters, or specific default filters. Up to 6 parameters can be passed to the target report

New syntax for GO URL in addition passing the parameters only supported in OBIEE 10.1.3.2 or above

New syntax for Go URL in Analytics. You can now pass as many parameters and values as you want
note the syntaxt &col1=&val1=
http://webserver/analytics/saw.dll?Go&Path=%2Fshared%2FSupplier%2FRegionDollars&Action=Navigate&col1=Periods.%22Year%22&val1=%221999%22&op1=eq&nquser=Administrator&nqpassword=Administrator

Also an operator can be included in the URL, default is ‘eq’ if op1 etc. are not included
http://webserver /analytics/saw.dll?Go&Path=%2Fshared%2FSupplier%2FRegionDollars&Action=Navigate&col1=Periods.%22Year%22&val1=%221998%22&op1=gt&nquser=Administrator&nqpassword=Administrator

The syntax is pretty flexible and can include as many parameters and operators there is no limit
http://webserver/analytics/saw.dll?Dashboard&PortalPath=%2Fusers%2Fadministrator%2F_portal&Page=TestPrompts&Action=Navigate&col1=Markets.Region&val1=%22EASTERN%20REGION%22&col2=Markets.District&val2=%22PHILADELPHIA%20DISTRICT%22&col3=Markets.Market&val3=%22PHILADELPHIA%22&col4=Periods.%22Year%22&val4=%222001%22&col5=Periods.%22Month%22&val5=%222001-03-01%22&col6=Periods.Week&val6=%22WEEK%20ENDING%2003%2F10%2F01%22&col7=Products.Type&val7=%22COATINGS%22&col8=Products.Brand&val8=%22Enterprise%22&col9=Products.UPC&val9=%22Enterprise%20Steel%20Gloss%22&nquser=Administrator&nqpassword=Administrator
http://webserver/analytics/saw.dll?Go&Path=%2Fusers%2Fadministrator%2FAllPromptTestReport&Action=Navigate&col1=Markets.Region&val1=%22EASTERN%20REGION%22&col2=Markets.District&val2=%22PHILADELPHIA%20DISTRICT%22&col3=Markets.Market&val3=%22PHILADELPHIA%22&col4=Periods.%22Year%22&val4=%222001%22&col5=Periods.%22Month%22&val5=%222001-03-01%22&col6=Periods.Week&val6=%22WEEK%20ENDING%2003%2F10%2F01%22&col7=Products.Type&val7=%22COATINGS%22&col8=Products.Brand&val8=%22Enterprise%22&col9=Products.UPC&val9=%22Enterprise%20Steel%20Gloss%22&nquser=Administrator&nqpassword=Administrator

Old syntax for passing parameters works both in OBIEE and previous releases e.g. 7.7, 7.8, 10.1.3.1 etc.

Pass one parameter
saw.dll?Go&Path=/Shared/Training/ParameterReport&Action=Navigate&P0=1&P1=eq&P2=Periods.Year&P3=1+1999
Pass 2 parameters
saw.dll?Go&Path=/Shared/Training/ParameterReport&Action=Navigate&P0=2&P1=eq&P2=Periods.Year&P3=1+1999&P4=eq&P5=Customers.State&P6=1+CA

Here the operator P1=eq can be of different type as documented in the Siebel Analytics Web Admin guide e.g. like, lt, gt etc.
saw.dll?Go&Path=/Shared/Training/ParameterReport&options=md&Action=Navigate&P0=2&P1=eq&P2=Customers.State&P3=1+CA&P4=like&P5=Products.Type&P6=1+”B%”

Include the numeric parameter value in “ e.g. &P2=Periods.Year&P3=”1998”
Also position Like operator at the end of the parameter list.

Passing parameter to a Dashboard prompt

If a Dashboard is using prompts then values can be passed to it similar to above syntax as follows
http://webt43/analytics/saw.dll?Dashboard&PortalPath=/shared/Training/_Portal/Training&Page=Filters&Action=Navigate&P0=1&P1=eq&P2=Products.Type&P3=Beef

Issuing Direct SQL to Siebel Analytics using URL syntax

Following URL syntax can also be used to directly issue a SQL against Analytics
saw.dll?Go&SQL=select+Region,Dollars+from+SupplierSales
following URL will bypass web cache and issued directly to the Analytics server
saw.dll?Go&IssueRawSQL=select+Region,Dollars+from+SupplierSales

Calling BI Publisher reports directly similar to GO URL

URL to directly call a BI Publisher report.
It will prompt the login screen if BI publisher is not single sign-on with the calling app
http://webserver:9704/xmlpserver/Business+Intelligence/Paint+Demo/Paint+Demo.xdo

Calling BI publisher report from OBIEE URL similar to Go URL syntax
Use ExecuteReportObject syntax
http://webserver/analytics/saw.dll?ExecuteReportObject&Path=/Business%20Intelligence/Paint%20Demo/Paint%20Demo.xdo

New syntax for Go URL in Analytics. You can now pass as many parameters and values as you want
note the syntaxt &col1=&val1=
http://webserver/analytics/saw.dll?Go&Path=%2Fshared%2FSupplier%2FRegionDollars&Action=Navigate&col1=Periods.%22Year%22&val1=%221999%22&nquser=Administrator&nqpassword=Administrator

Calling a Dashboard page works the same way.
If Page has some prompts then those can also be filtered using new syntax
http://webserver/analytics/saw.dll?Dashboard&PortalPath=%2Fusers%2Fadministrator%2F_portal&Page=page2&Action=Navigate&col1=Periods.%22Year%22&val1=%221999%22

If a page has only a BI publisher report and also has a prompt then
You can pass filters to the BI publisher report using Go URL syntax as below
http://webserver/analytics/saw.dll?Dashboard&PortalPath=%2Fusers%2Fadministrator%2F_portal&Page=page2&Action=Navigate&col1=Periods.%22Year%22&val1=%221999%22


Thanks,
Satya Ranki Reddy


Reload Server Metadata OBIEE 11g. 


In 11g, to refresh the individual subject areas the button in drop down is provided at the top of the subject area.
I couldnt recognize them earlier. Thanks to OTN forum for pointing this valid point.


Thanks,
Satya Ranki Reddy


OBIEE 11g Installation AIX- Windows Server 2008 64 Bit


Reading through the documentation made me realize that it’s not possible to do a ‘Enterprise Install’. Check the following part in the manual:

1.4.3 Software Only Install
The Software Only Install type installs the Oracle Business Intelligence software binary files in an Oracle home for later configuration as part of a Fusion Middleware deployment. This install type is required to install Oracle Business Intelligence on an AIX operating system or with a 64-bit JVM, such as on a supported 64-bit operating system.”

Th following could be a guideline to install Oracle BI 11g on Windows Server 2008 R2 64bit:
Install RCU –> rcuHome\BIN\rcu.bat
Install JDK 64bit
Install Weblogic generic –> via the Command Line java -jar wls1033_generic.jar
Install Oracle BI11g –> ‘Software Only’

Run config.bat to configure Oracle BI11g –>C:\Oracle\Middleware\Oracle_BI1\bin\config.bat

Of course you need to check the manual for additional info. Next to that you have to perform a

‘Software Only’ install on 32bit machine to be able to use your client tools.


OBIEE 11g Install High level Steps :

OBIEE 11g release latest version (as of 30 April 2011) is 11.1.1.3 which can be downloaded from here
Software Required
1. Database (Oracle, IBM DB2 or MS-SQL)
2. Repository Creation Utility (RCU)
3. OBIEE 11g (11.1.1.3 is latest OBIEE as of 30 April 2011)
4. WebLogic 10.3.3 (Optional – Only required for 64 bit machine or IBM AIX)
5. JDK 1.6 64 bit (Optional – Only required for  64 bit machine)
.
OBIEE 11g Installation Key Points
1. OBIEE includes Answers, Dashboards, Delivers, Repository Administration Tool, Office, Oracle Business Intelligence Publisher and Oracle Real Time Decisions. When you install OBIEE you select from below three products.
.

.
2. Unlike other fusion middleware products, All Business Intelligence components intended for a WebLogic domain must be configured at the same time. i.e. It is not possible to extend an weblogic domain containing some OBIEE components, to include other OBIEE components at later stage.
3. If you are installing OBIEE on 64 bit machine then use software install and configure OBIEE using 64 bit JDK later using config.sh or config.bat.
4. Like most of other Fusion Middleare components, OBIEE consists of two type of components i.e. Java Components (running on weblogic domain) and System Components (managed by OPMN and run as BI Instance). For more information on Fusion Middleware concepts click here
5. Java Components include Action Service , BI Office, BI Publisher, RTD …where as System Components include BI Server, BI Java Host, BI Presentation Service, Cluster Controller, BI Scheduler…
6. After installing OBIEE 11g on a machine, do not install OBIEE 10g. You can install OBIEE 11g on a machine on which OBIEE 10g is already installed (Shutdown OBIEE 10g before installing OBIEE 11g)
7. OBIEE supports following installation types
a) Simple Install - OBIEE installation on single machine with minimal input required from user during installation/configuration (useful for development environments)
b) Enterprise Install- More configuration option than simple install or to scale out enterprise deployment for single or multi node OBIEE deployment. (Useful for production, pre-production and performance test environments)
c) Software Install – This installation type installs just OBIEE binaries which you must later configure. (Use this installation type for 64 bit machines or IBM AIX)
.

.
8. In software only installation type (third option above) install WebLogic Server first (this will create middleware home) and then install OBIEE software in this middleware home.
9. High Level OBIEE 11g installation step for 64 bit machine are (Installation of JDK, weblogic, and OBIEE config step are not required for simple install on 32 bit machine)

a. Install Database
(or use pre-existing database) to create OBIEE schema (Only Oracle, MS-SQL server, IBM DB2 are certified database for OBIEE schema)
b. Create OBIEE schema (BIPLATFORM , MDS) using RCU , more on RCU here (RCU is currently available for 32 bit Linux and Windows only)
c. Install 64 bit 1.6 JDK (Sun or JRockit)
d. Install WebLogic using 64 bit JDK (Use steps mentioned here ). Make sure you install correct weblogic version i.e. use 10.3.3 weblogic for 11.1.1.3 OBIEE . DO NOT install weblogic 10.3.2 or 10.3.4 weblogic with 11.1.1.3 OBIEE

e. Install Business Intelligence Software
using setup.exe (windows) or runInstaller (Linux)  (This step will install WebLogic and OBIEE software and create WL_HOME and ORACLE_HOME for OBIEE i.e. Oracle_BI1)
f. Configure OBIEE using config.sh or config.cmd from $OBIEE_ORACLE_HOME/bin (This step will create domain containing WebLogic Admin Server and one or more managed server)
10. You can scale out OBIEE installation either vertically or horizontally. In vertical scaling two or more nodes of OBIEE cluster are installed/configured on same machine. In Horizontal scaling out, each OBIEE node of cluster is installed on its own dedicated machine.

.
11.You can install OBIEE interactively (default mode) or in silent mode . For silent installation use option -silent and provide response file with option -response  i.e. runInstaller (or setup.exe) -silent -response response_file
12. After installation, verify following URLs
Web Application running on Admin Server (default port 7001)
a) WebLogic Console – http://servername:7001/console
b) Fusion Middleware Control – http://servername:7001/em
Web Application running on Managed Server bi_server1 (default port 9704)
c) Analytics – http://servername:9704/analytics
d) Web Service Manager Policy Manager – http://servername:9704/wsm-pm
e) BI Publisher – http://servername:9704/xmlpserver
f) Real Time Decisions – http://servername:9704/ui
g) BI Office – http://servername:9704/bioffice/about.jsp

Thanks,
Satya Ranki Reddy

Wednesday, August 22, 2012

FMAP in OBIEE 10g & OBIEE 11g

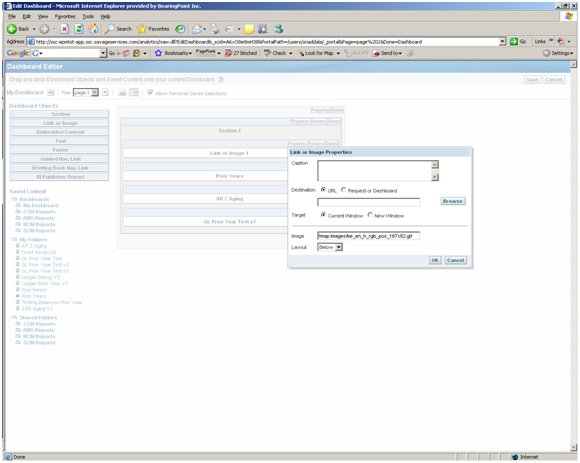
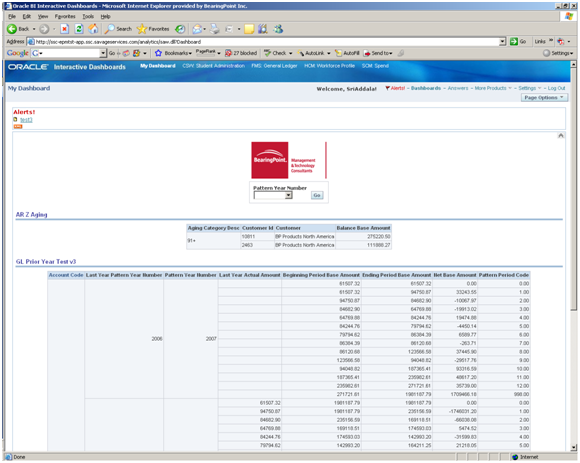
Using fmap syntax we can add images to the dashboard that is stored in the Oracle Business Intelligence Environment. So If want to use any image like logo with a saved request / dashboard in OBIEE 10g or with any analysis/dashboard in OBIEE 11g we can use fmap.


Syntax: fmap:images/imagename.imageformat
for e.g: fmap:images/regport_geographical.jpg


The syntax is same for 10g and 11g.
We can find the images from the below path in 10g and 11g. As per your working BI version you can browse the corresponding folder and select the image and can use the same image in your saved request or analysis.


OBIEE 10g Path:
In OBIEE 10g the images are located in two places.
If you want show any of your custom images then you have to add that images into the below mentioned paths and can use the same images with fmap syntax.


1.C:\OracleBI\oc4j_bi\j2ee\home\applications\analytics\analytics\res\s_oracle10\   
   images
     (and)
2. C:\OracleBI\web\app\res\s_oracle10\images


OBIEE 11g Path:
If you want to show any of your custom image then you have to add that image into the below mentioned paths and can use the same images with fmap syntax.
1. C:\OBIEE11g\Oracle_BI1\bifoundation\web\app\res\s_blafp\images
      (and)
2. C:\OBIEE11g\user_projects\domains\bifoundation_domain\servers\bi_server1\    
    tmp\_WL_user\analytics_11.1.1\7dezjl\war\res\s_blafp\images


OBIEE 11g fmap Syntax screenshot for sample image in Title View:

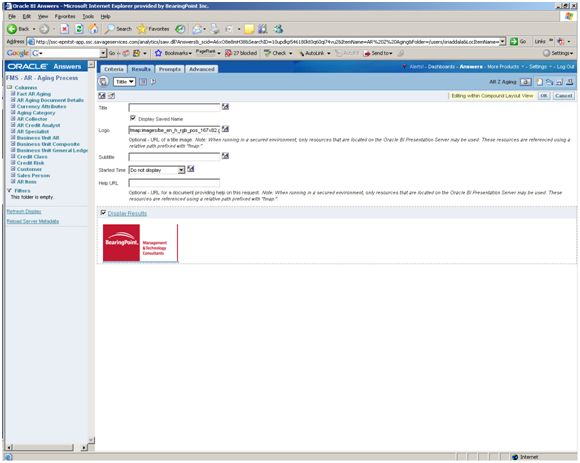
OBIEE 11g fmap Syntax screenshot for sample image in an Analysis:


Displaying Images in OBIEE 10G


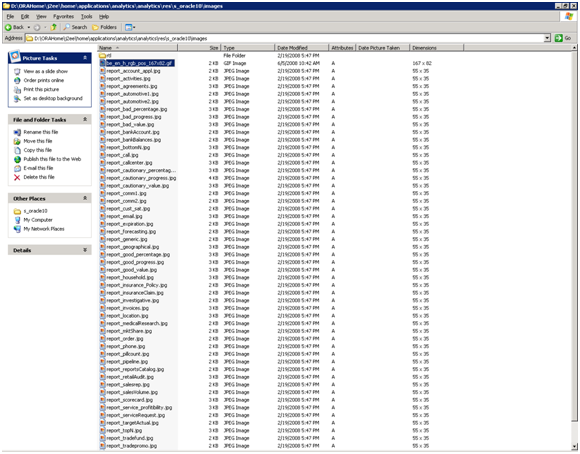
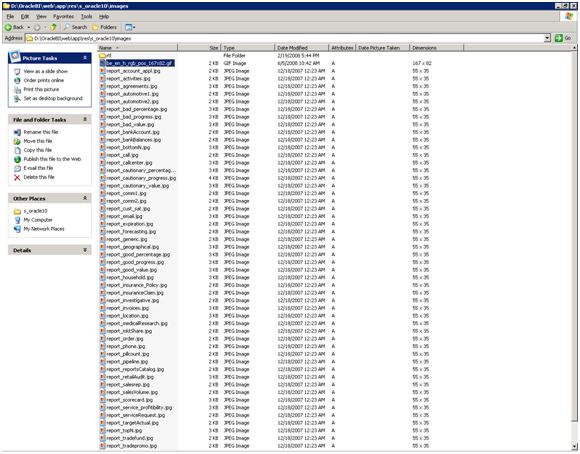
1. Upload the images to following two folders


D:\ORAHome\j2ee\home\applications\analytics\analytics\res\s_oracle10\images (Oracle application server install)


D:\OracleBI\web\app\res\s_oracle10\images (OBIEE install)


2. After adding images to the folders you need to restart the presentation services


3. In answers, edit the title view and add the following
fmap:images/your_namename.gif


In dashboard you can use the same with image or link and fmap:impages/your_gif.gif


Thanks,
Satya Ranki Reddy

Tuesday, August 21, 2012

1) Create a prompt day week and declare presentation variable


2) Here is the report ,i pulled product and booked qty

To show 30days back booked quantity the date selected in prompts

In fx use

FILTER("Facts Other"."Booked Qty" USING (Time."Day Date"=TIMESTAMPADD(SQL_TSI_DAY, -30, DATE '@{day}')))


You can apply the same formula for 1....n days

For month level use
FILTER("Facts Other"."Booked Qty" USING (Time."Day Date"=TIMESTAMPADD(SQL_TSI_MONTH, -3, DATE '@{month}')))

where -3= three months back

Thanks,
Satya Ranki Reddy